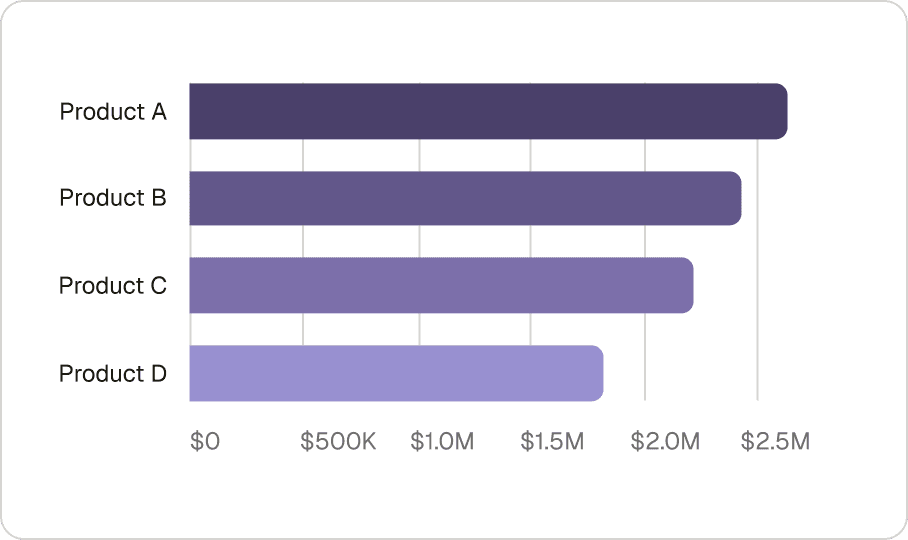
ValueMap for Executive Leadership Teams
Gain absolute clarity on strategic capital performance.
Get a true birds eye view of organizational health. Audit high-level portfolio metrics from a unified home dashboard and explore published financial scenarios without changing underlying models.
Get started for free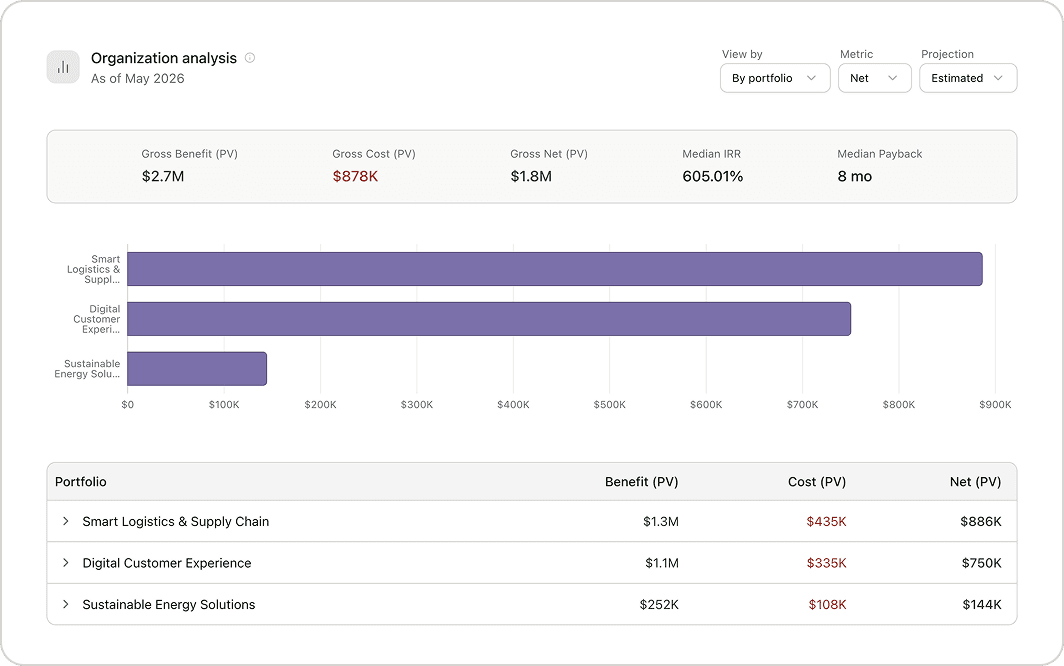
Solve your executive leadership team's value challenges
Fragmented status reporting
Executives are forced to synthesize scattered slide decks to evaluate portfolio progress. ValueMap compiles active project stats and financial data into a single screen.
The post-approval visibility vacuum
Capital is frequently allocated without clear, structured visibility into real-world variance. ValueMap provides continuous insight into monthly actual performance.
Accidental formula manipulation
Reviewing underlying business models can accidentally lead to corrupted formula cells or broken relationships. ValueMap offers read-only viewer options to preserve model stability.
Executive Dashboard
Track active projects and baseline metrics at a glance.
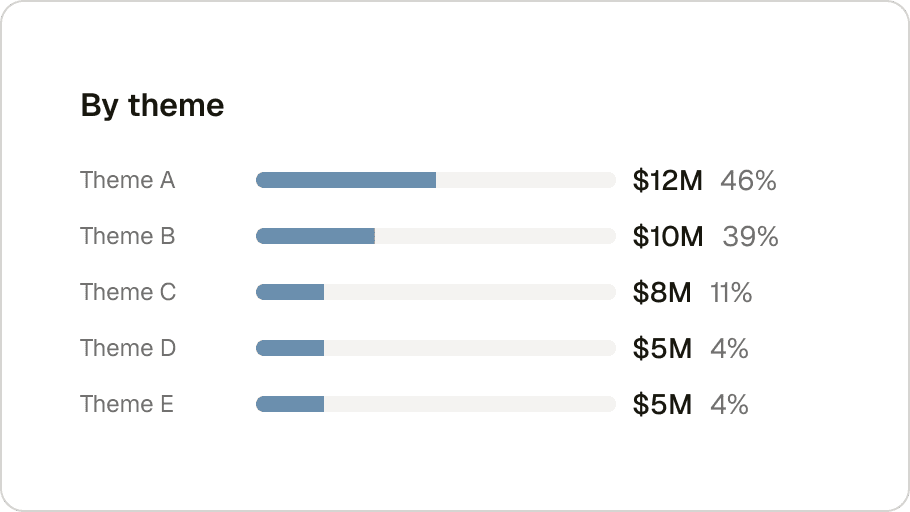
Keep your finger on the pulse of corporate capital allocation without getting lost in dense spreadsheets. Monitor high-level portfolio stats on a unified home interface that surfaces active project counts, confidence parameters, and risk concentration spreads.
Strategic Canvas View
Inspect your complete corporate architecture.
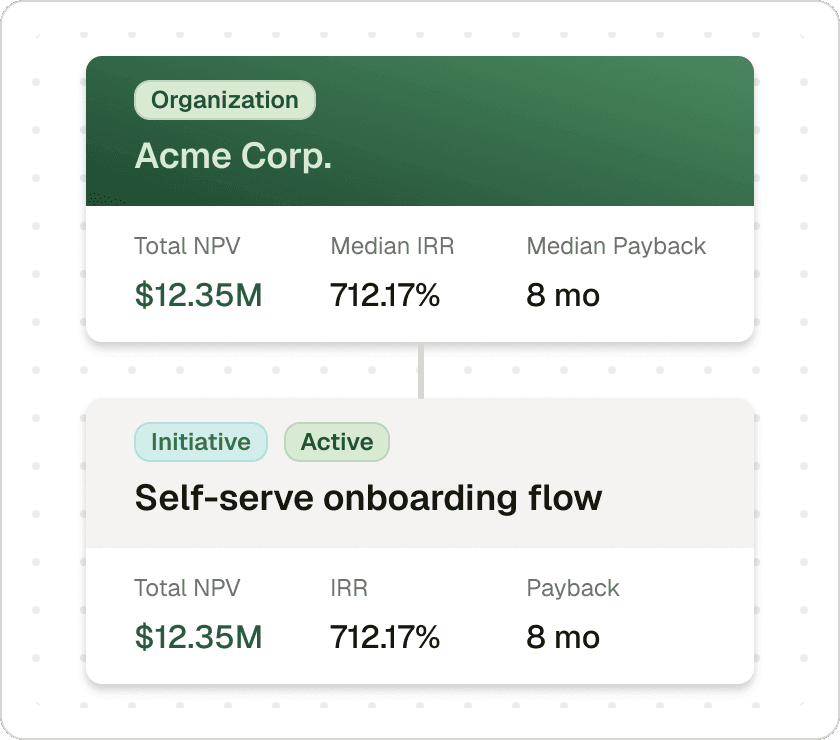
Inspect the architecture of your entire business using a sleek, interactive tree layout. Drill down smoothly from top-tier portfolio buckets into specific product categories and underlying initiatives to verify strategic alignment at a glance.
Published Scenario Inspection
Review risk tolerances safely with read-only access.
Analyze baseline assumptions and risk tolerances safely without accidentally corrupting active data models. Utilize read-only Viewer access to inspect published scenario details, review applied value percentages, and evaluate variations across past initiatives.