ValueMap for Value Governance
Complete visibility across your entire strategic tree.
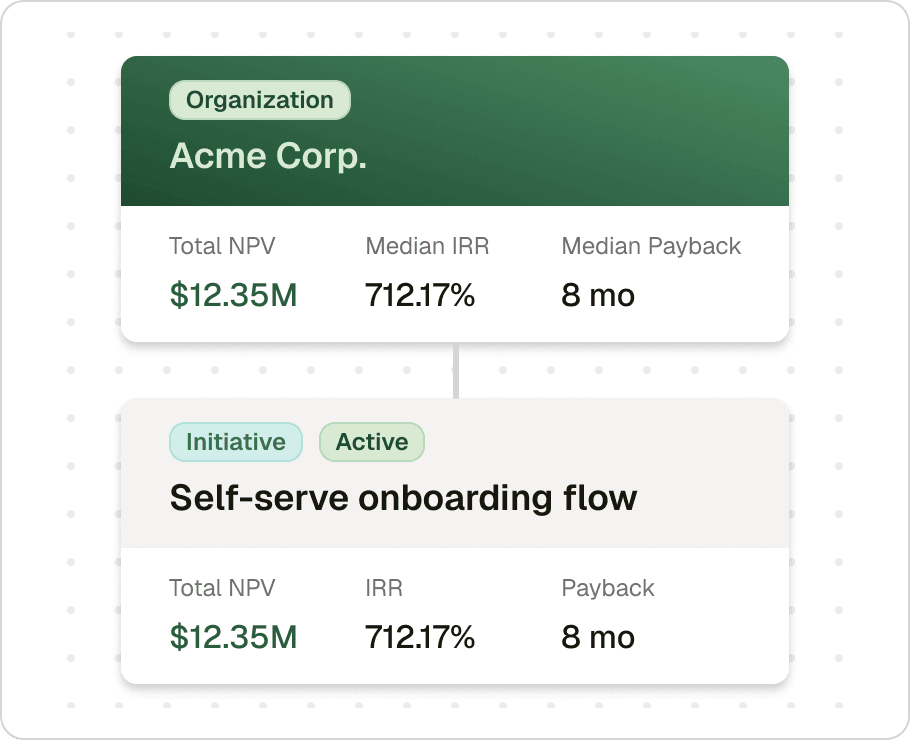
Map your corporate hierarchy on an interactive canvas view. Enforce clear approval workflows and monitor risk distribution using live dashboard metrics.
Get started for free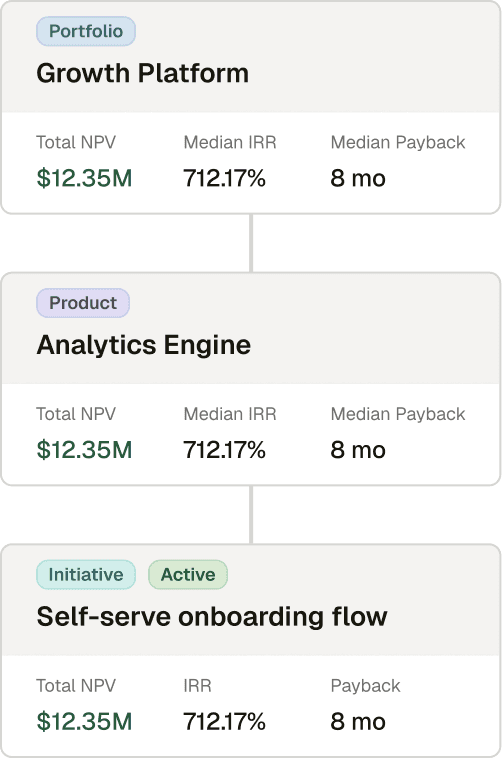
Solve your most critical value governance challenges
Siloed strategic assets
Disconnected spreadsheets make it impossible to see how initiatives map back to broader products. ValueMap organizes everything into a clear, unified organization tree.
Unregulated project progression
Projects skip critical reviews or stall in email threads. ValueMap locks progression behind formal lifecycle stages and explicit admin approval actions.
Hidden risk exposure
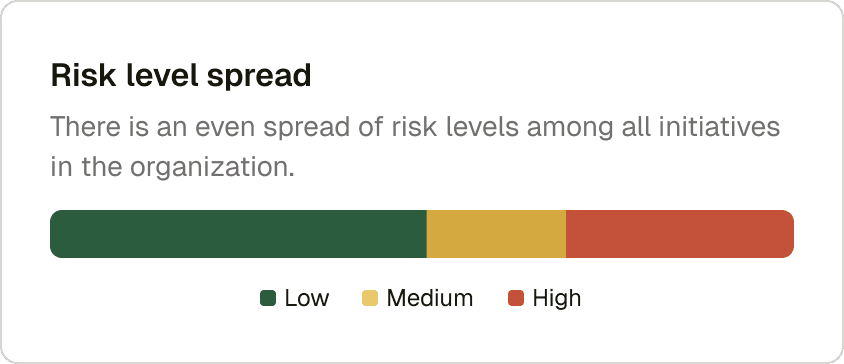
Portfolios easily accumulate risk concentration without clear warnings. ValueMap's dashboard surfaces aggregate risk spread and active project counts instantly.
Interactive Canvas
Inspect your complete organization hierarchy.
Navigate your entire corporate structure using an interactive canvas interface designed for a clear birds eye view. Effortlessly trace lines of accountability and ownership directly from the root parent organization object down through specific portfolios, products, and underlying execution initiatives.
Approvals Workspace
Manage reviews with explicit governance gates.
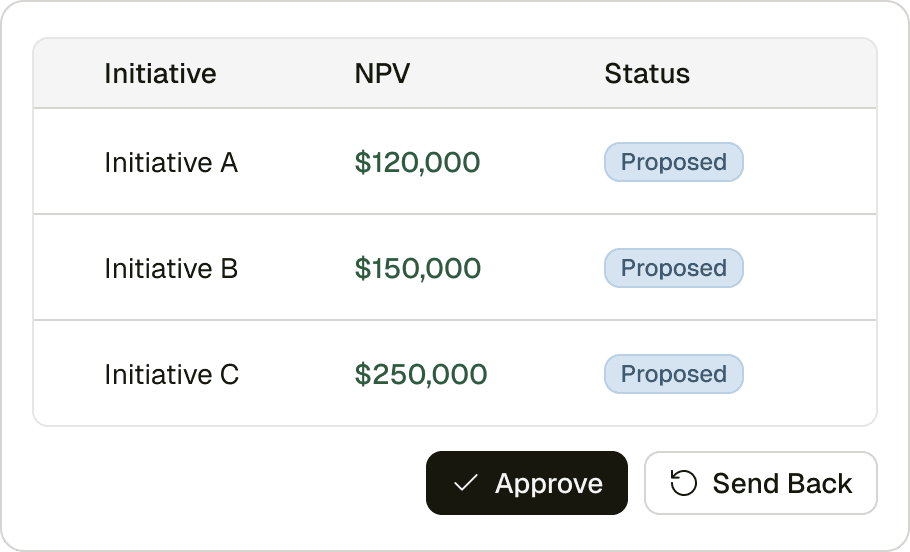
Process submitted proposals using a centralized administration queue that keeps review loops organized. Review complete initiative detail pages to analyze financial projections, and use explicit system actions to either approve an initiative into active status or send it back to the contributor with documented review notes.
Portfolio Analytics
Track risk concentration and project counts.
Access a unified home dashboard to monitor critical strategic health indicators across all departments. Track real-time aggregate statistics including total active project counts, cost contingency intervals, and your overall concentration spread of risk to ensure capital allocation matches your strategic mandates.