ValueMap for Value Realization
Turn forward-looking forecasts into historical tracking.
Drive ongoing accountability across the lifecycle of active initiatives. Log nominal monthly performance manually, automate present value discounting, and surface tracking gaps immediately.
Get started for free
Solve your most critical value realization challenges
The vanishing business case
Organizations fund massive proposals but rarely check if the promised value arrives. ValueMap introduces a structured cadence for ongoing tracking.
Lapsed data submissions
Missing performance numbers derail accurate portfolio evaluation. ValueMap targets tracking gaps by surfacing overdue actuals directly on the home dashboard.
Complex discounting math
Factoring present value adjustments into raw historical performance data is a manual nightmare. ValueMap applies PV calculation rules behind the scenes.
Actuals Tracking
Input nominal performance figures directly.
Keep a meticulous record of performance by entering actual figures manually on a month-by-month basis. Input raw nominal benefits and costs directly into nested rows alongside your original reference estimates, allowing you to establish a structured and clean data trail across the entire lifespan of an active initiative.

Overdue Alerts
Isolate lagging tracking metrics instantly.
Maintain strict administrative hygiene by instantly surfacing gaps in your monthly data collection cycle. The home dashboard flags lagging metrics immediately, allowing you to pinpoint exactly which teams or active initiatives have fallen behind on their manual actuals updates so you can keep portfolio data accurate.

Realized Analytics
Toggle projections to isolate variance.
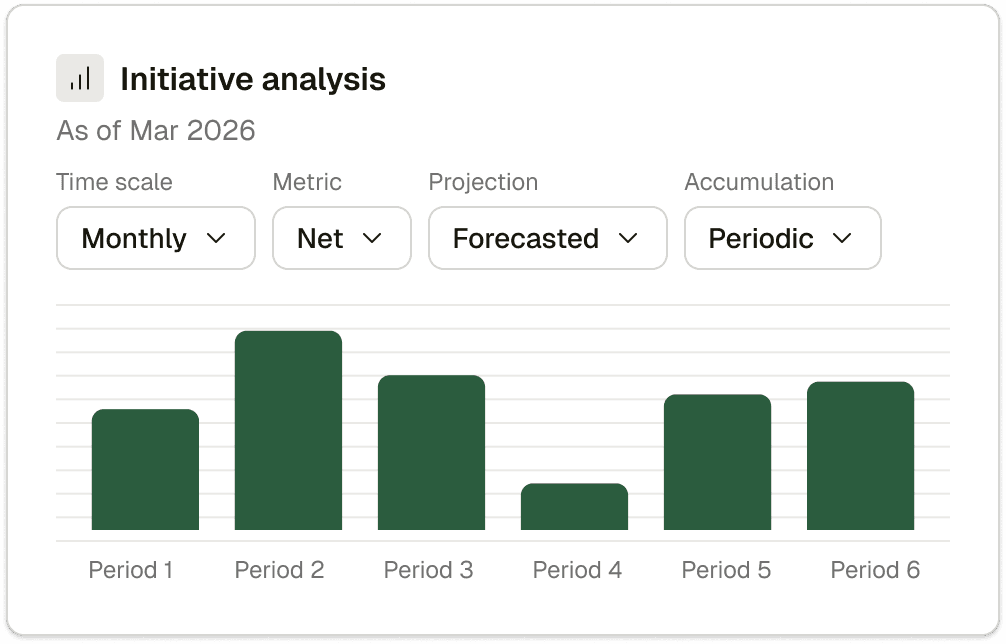
Bridge the gap between forward-looking forecasts and historical performance using interactive variance charts. Toggle the built-in projection selector to overlay your manually logged nominal actuals against baseline models, with the engine automatically applying present value adjustments behind the scenes.